How Do Dashboards Help You Run Your Health Resort Better?

Dashboards are not reports; reports are just pieces of the puzzle. Reports give you the raw details, but you have to piece them together yourself. Dashboards show you the big picture and help you notice changes such as a drop in occupancy or a spike in cancellations. No more collecting, combining, and processing information to reach important conclusions. Dashboards show you clear insights and ready-to-use strategies.
Why Does Your Health Resort Need Dashboards?
To Make Smart Decisions
No room for guesswork. Every decision should move your health resort toward your goals. This means choices based on up-to-date numbers.
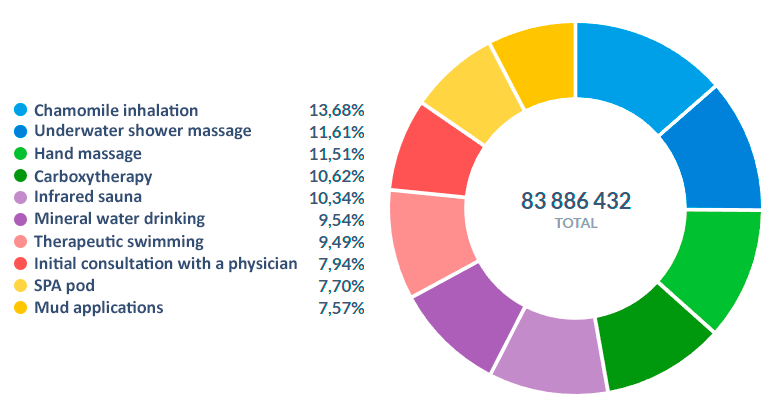
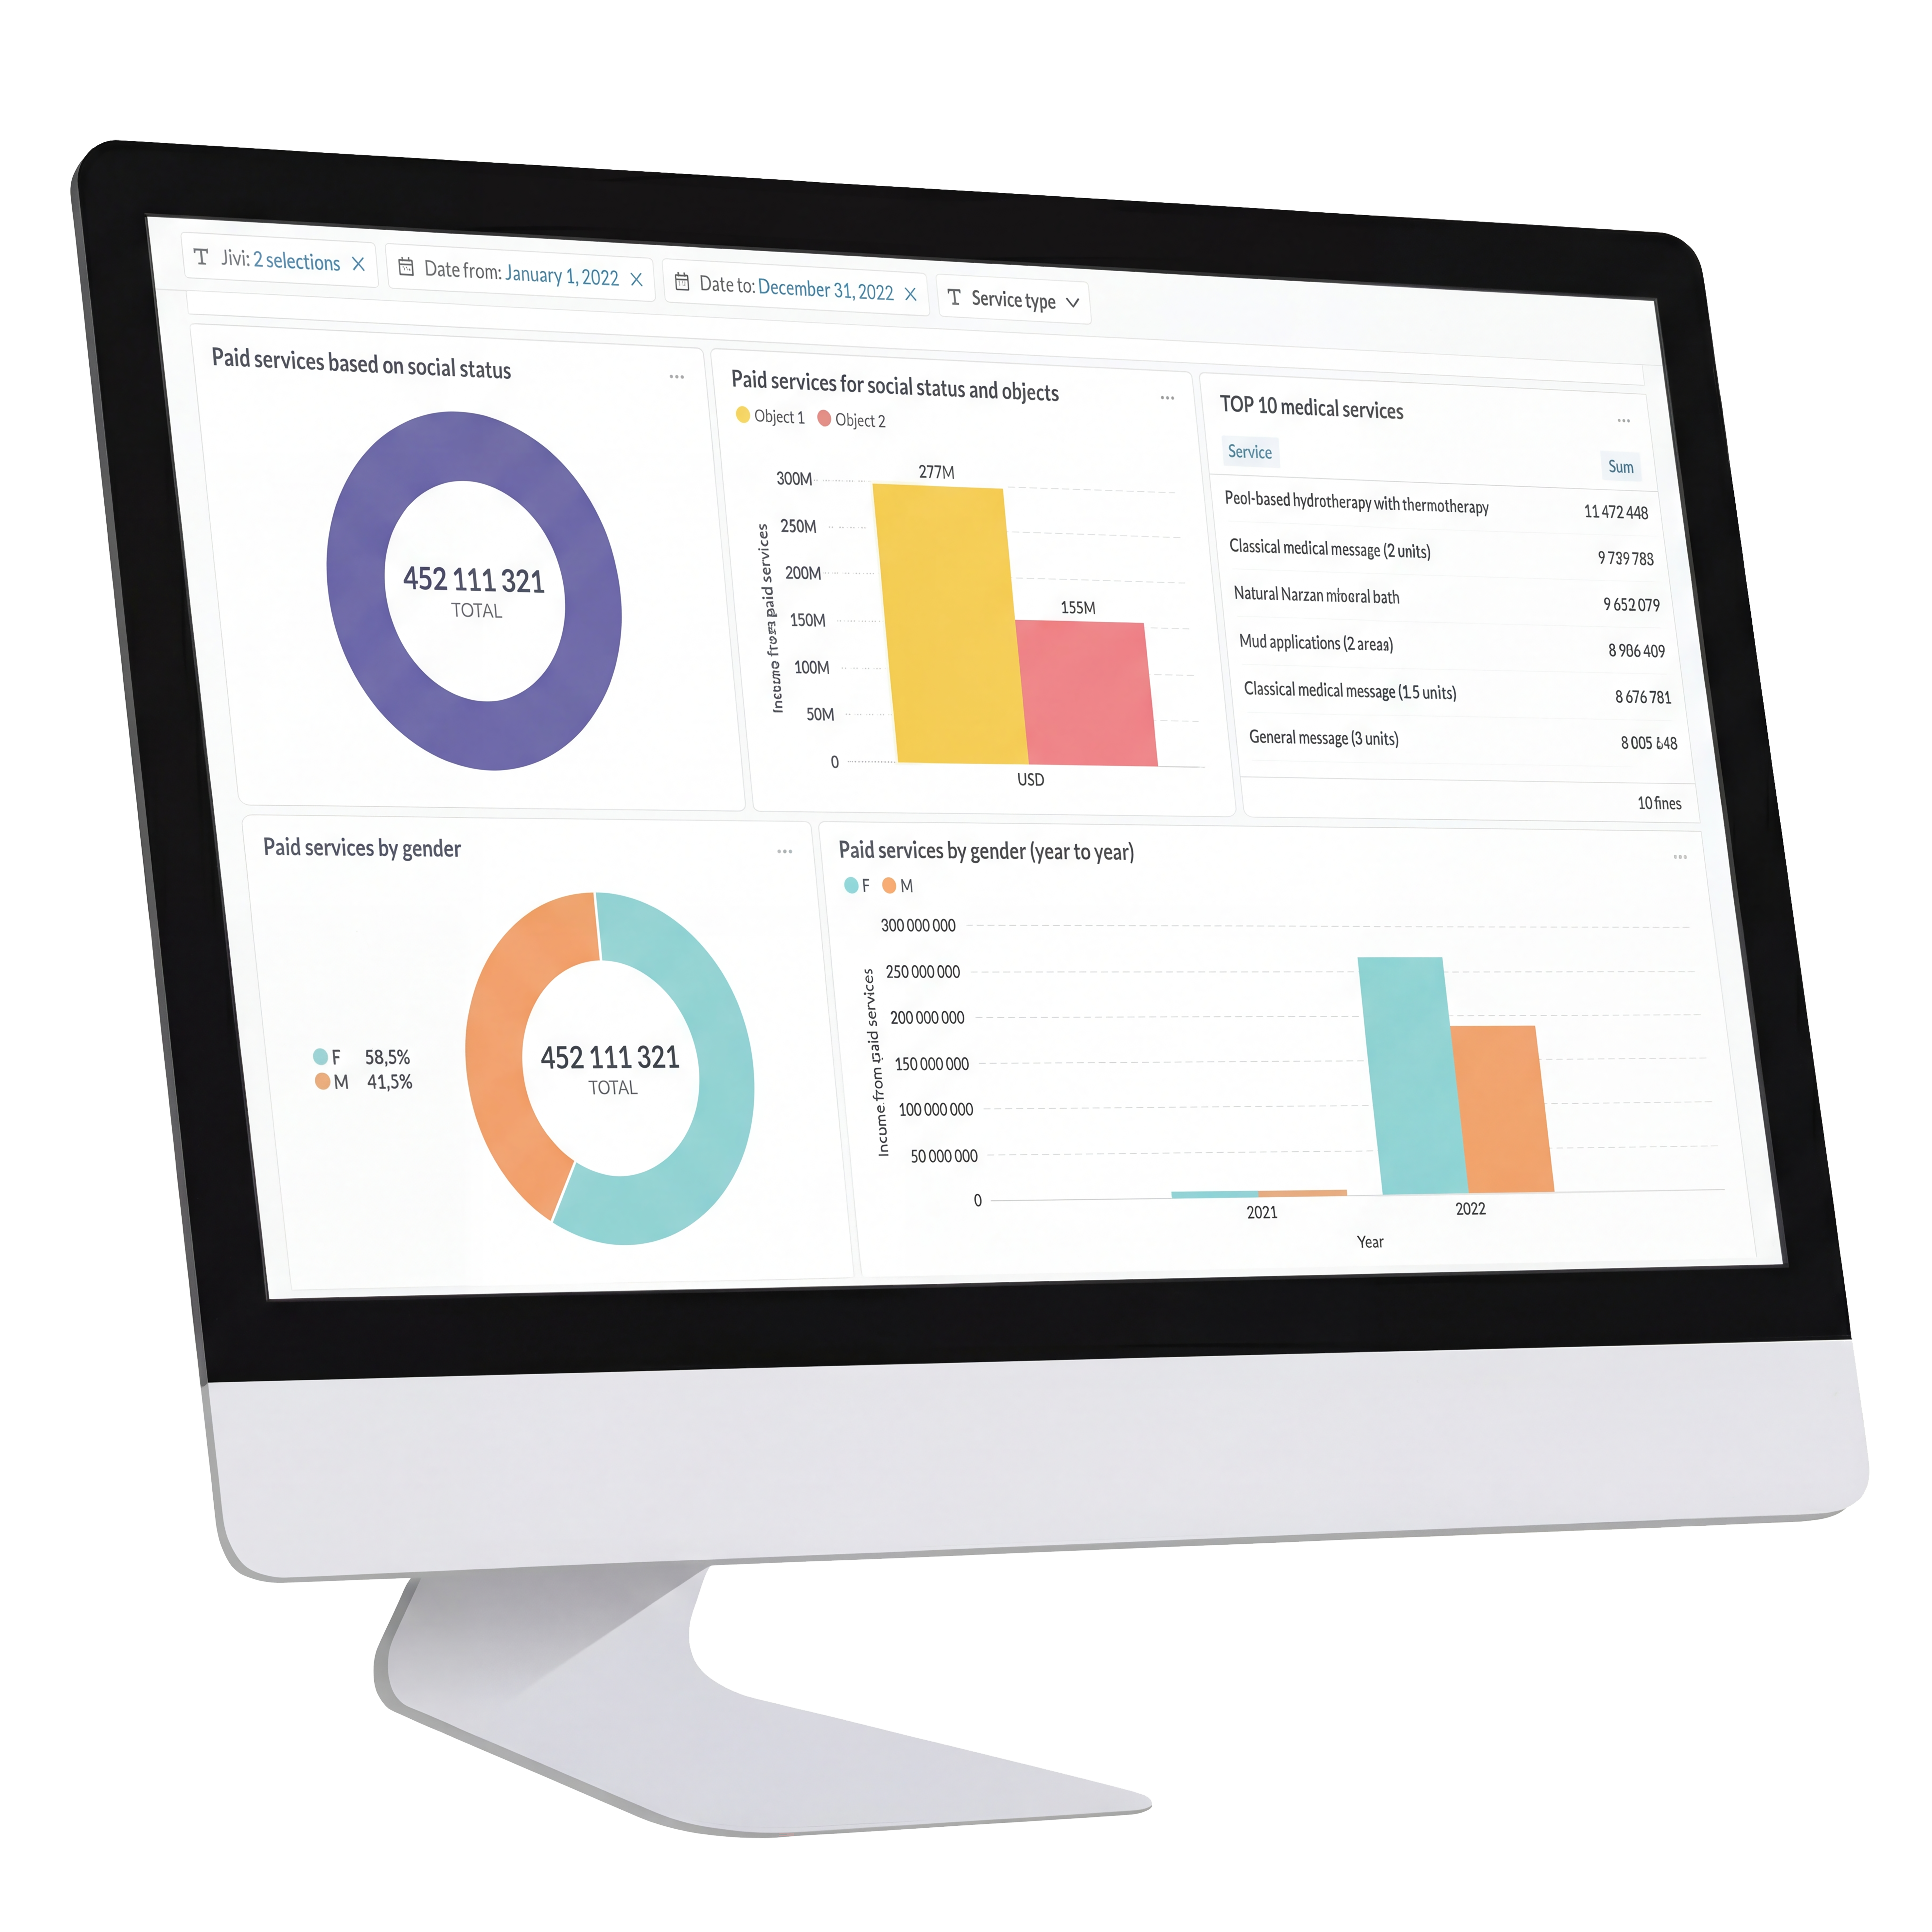
Chart “Top 10 Medical Services”
To Get Fast Access to Real Numbers
How quickly would you detect a drop in cryosauna occupancy? Or that cancellations suddenly spiked? You need to spot a spark before it becomes a fire. Or catch a wave and ride it for maximum profit.
You cannot do that if you learn about a problem weeks or months later, after someone collects the data, builds the spreadsheets, and puts a report on your desk. Numbers might also be polished to look better than reality.
Dashboards fix this. No more waiting, no more human error. See what is really happening at your enterprise.
Need to see how new services are performing? Check. Want to know which staff members are the most productive? Check. Want to compare revenue from extra services across multiple locations? Check. Open the dashboards on your phone or tablet anytime.
How much does a health facility multidimensional automation cost? It depends on several parameters. Fill out a short form to find out. As a bonus, you will get a calculation template «7 customer service indicators».
What do Dashboards in Jivi Cover?
Revenue. See how your income changes over any period of time. Total revenue or by category: accommodation, food services, and medical services. See how much each treatment package contributes to your bottom line.
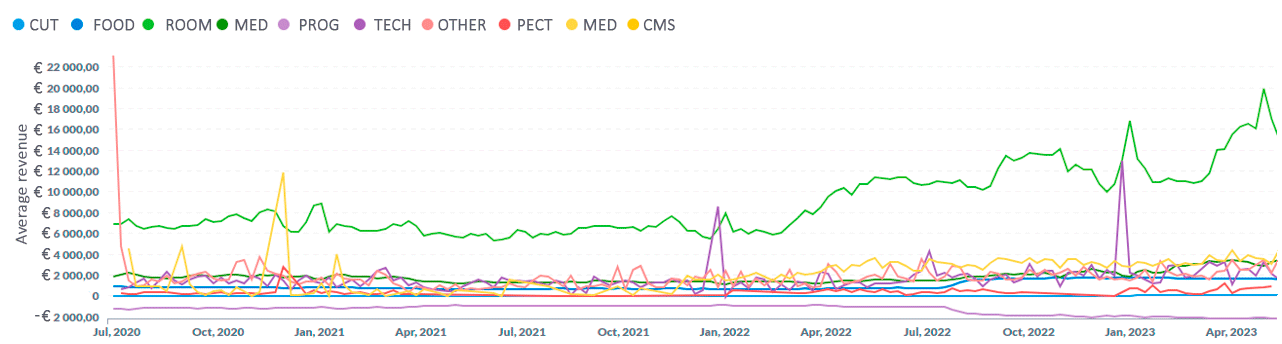
Chart “Average Revenue by Type”
Occupancy. Monthly occupancy rates, average length of stay and cancellation trends are in one place.
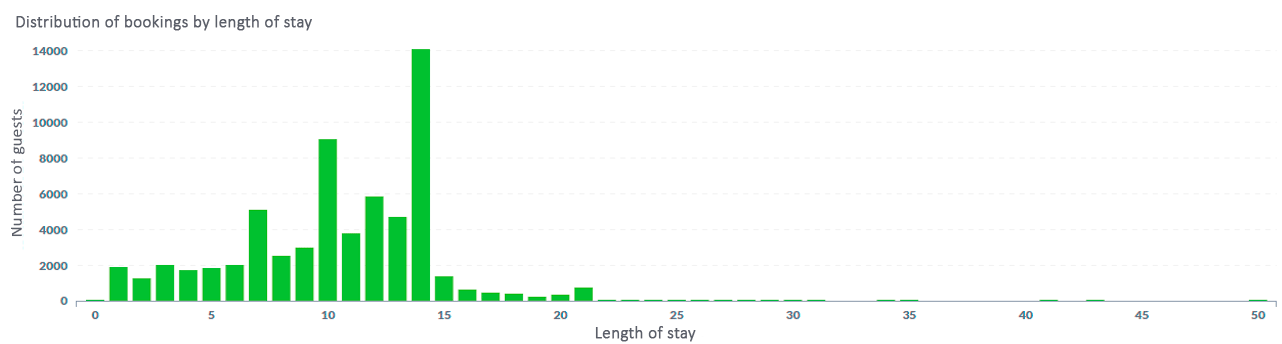
Chart “Distribution of Bookings by Length of Stay”
This section helps you:
- Understand your unique seasonal patterns. Prepare for slow periods in advance.
- Spot unusual drops in guest activity. Fix problems early.
- Build better programs based on how long guests actually stay.
If guests never stay more than a week and complain about poor results, take a hard look at your treatment packages and processes.
Treatment Room Capacity. How busy is each room? Which services are popular? Use this to build better packages. Plan smarter marketing. Drop services that lose money.
Staff Workload. See how busy your team is overall and individually. What are your employees doing? Detailed workload data helps you use everyone’s time better and give free specialists other tasks.
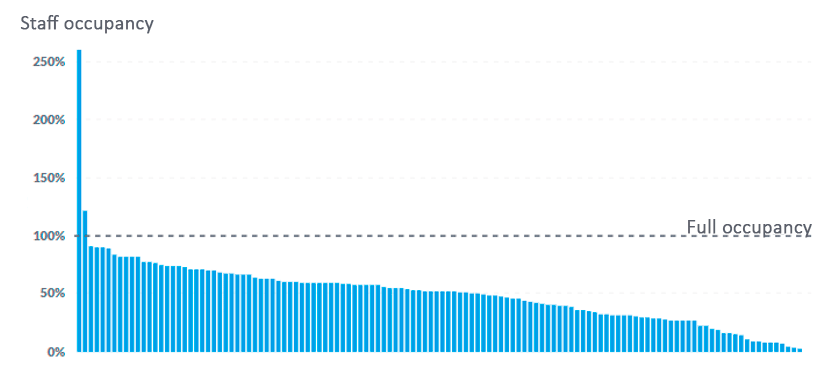
Chart “Staff Occupancy”
Staff Motivation. Your medical staff is the main reason patients come back, so you need to get their KPIs right. Link their pay to real metrics: how many treatments they provide, how many extra services they sell, and how many repeat patients they have. This builds strong relationships with good employees and improves service quality across the board.
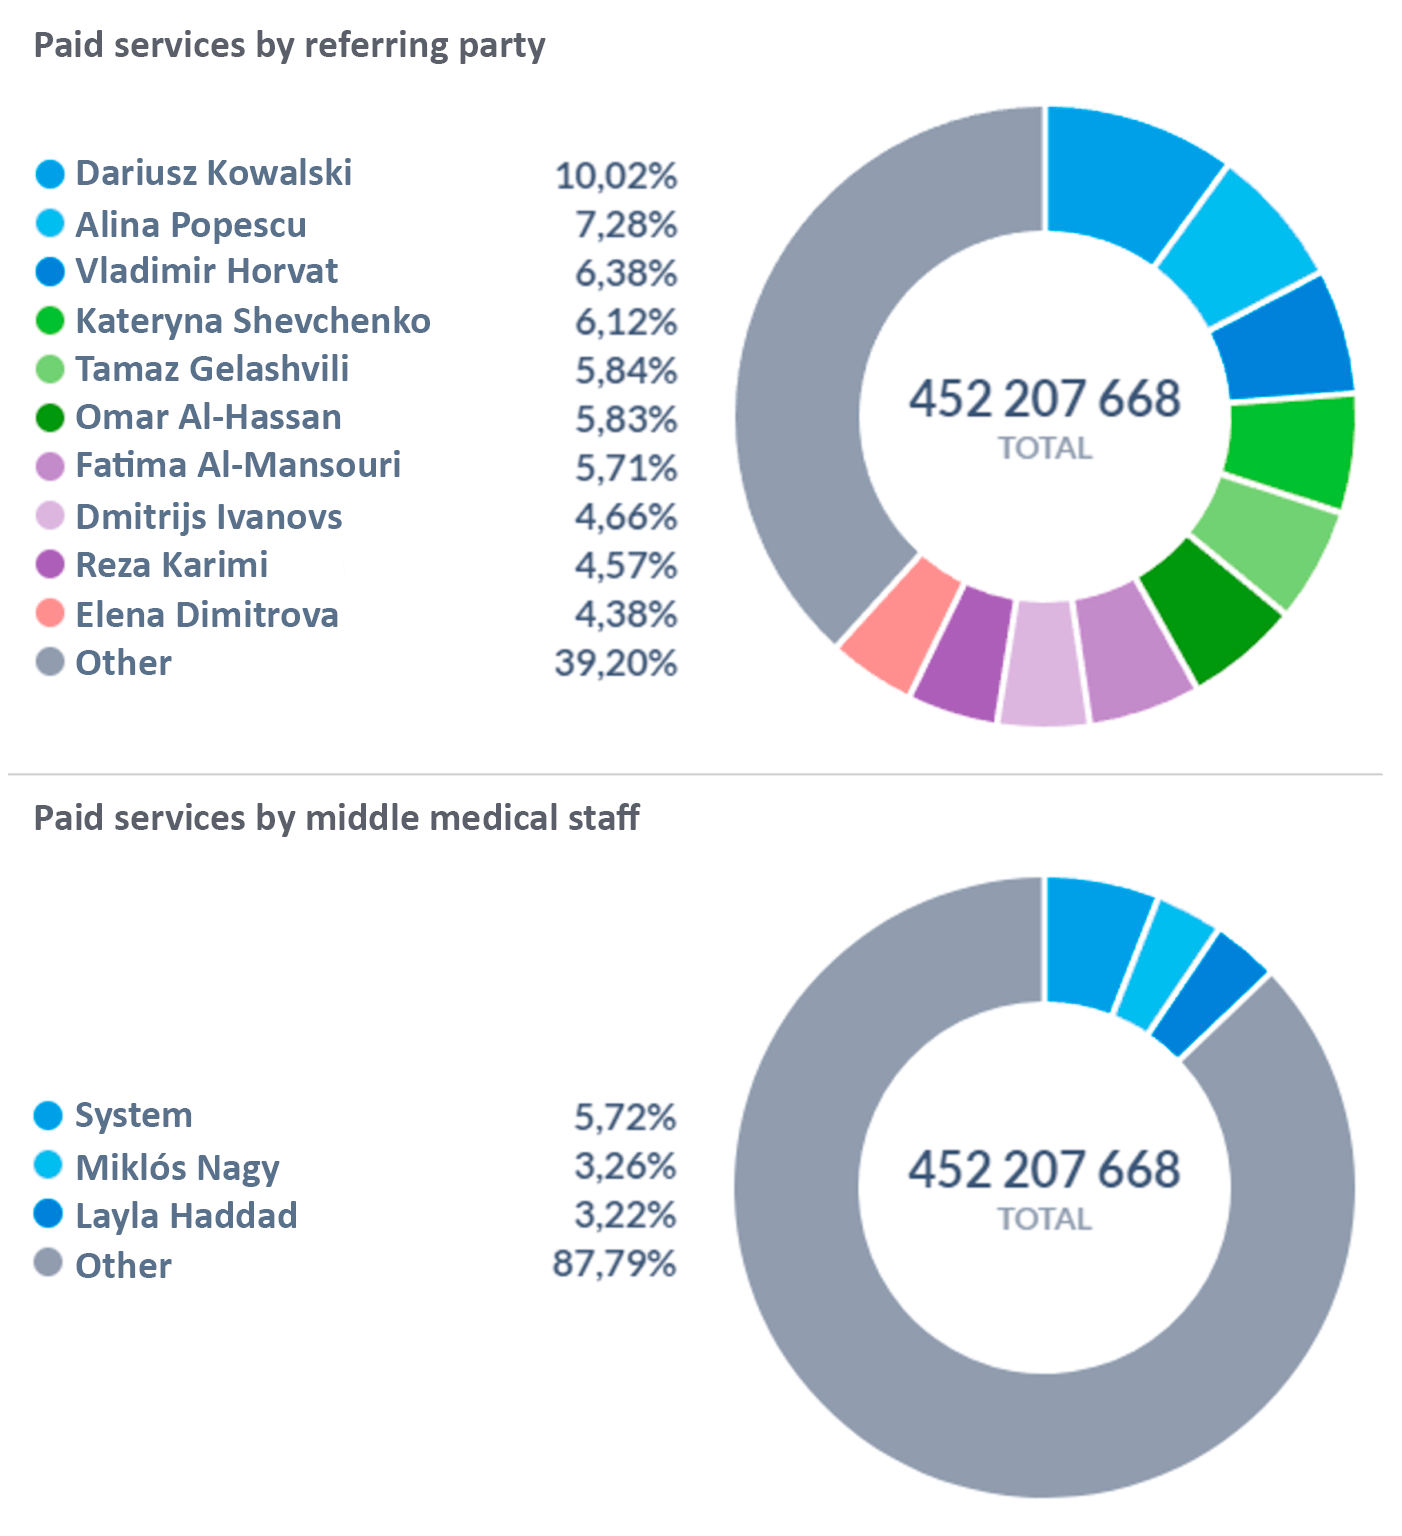
Chart “Paid Services by Referring Specialist and Middle Medical Staff”
Dashboards show you each person’s contribution. Reward your top people and have them train the rest of the team.
Loyalty Program Members. See how fast your loyal customer base is growing. Track points earned and spent. See how many bookings come from loyalty members. The chart showing guests by level tells you a lot. Who is at your resort right now: new or returning guests, VIPs, corporate clients? How are these segments changing over time? If new guests keep growing but returning guests are shrinking, something is wrong. And it is time to find out why.
You are not limited to the dashboards we built. Any report in Jivi can become a chart. Add it to your personal dashboard.
Management Knows Everything. How many patients did each doctor see today? How many rooms did housekeeping clean? How much revenue did you make from extra services? How many were provided? A manager with dashboards becomes all-seeing and can step in fast when something looks wrong.
Forecast Numbers. Prepare for the low season the way you prepare for winter. When you see monthly trends year after year, you can predict what comes next. It works much better than panicking and slashing prices. Not sure whom to target during slow months? Your ABC XYZ report already knows. It lists your most loyal and profitable guests.
Find Growth Opportunities. Loyal customer base not growing? Average check per guest going down? Find your weak spots and turn them into growth areas. Set clear, measurable goals. Let’s say you want to focus on guest loyalty.
Pick the dashboards that track return visits, write down where you are now and build a strategy with your team to improve. Example: right now, 60% of loyalty points expire unused. Goal: drop that to 40% in one year. Activate every step of a repeatable sales process. Check results next year.
See What Is Happening Across Your Network. Managing multiple locations? Dashboards become even more important. No more asking for reports from each resort — just log in. See the numbers for any location and compare them.
Boost Healthy Competition. See one resort with better numbers? Higher revenue? Better occupancy? Compare their processes. Healthy competition drives growth and sparks new ideas. Want to make it fun? Run a yearly contest with real prizes.
Pick a few categories. Let your health resorts compete. Most treatments provided. Highest revenue from extra services. Best return visitor rate. Whatever matters to you.
Each location builds its own strategy and implements its own ideas. Announce the winners at your New Year’s party or stream it live. Teams can check the charts anytime during the year, adjust their plan, and build team spirit. And if you’re managing a network of resorts, you know that fresh perspectives can make the difference.
The Jivi Telegram channel is a helpful resource for doctors, executives, managers, and marketers who work in health resorts and wellness centers. We cut through the noise to deliver insights that matter:
- In-depth articles and case studies
- Latest industry trends and news
- Practical tools and smart approaches turned into simple how-to guides
- Ready-to-use checklists and forms to save your time

Test New Ideas. There is no growth without experiments so keep testing new ideas. Put a self-check-in kiosk in the lobby, run a sales workshop for doctors, update the scripts your sales team uses. See how it affects guest satisfaction and revenue.
Attract Investors. Want to show investors how attractive your project is? Show them your main assets, loyal guests, revenue from extra services, how full your resort stays, or how well your team performs. Share forecasts based on your current numbers. Dashboards tell the story better than any paper reports. Investors will love watching their returns in real time.